What Jira always needed,
but Atlassian never built.
Map dependencies. Detect blockers. Ship faster!
Map dependencies. Detect blockers. Ship faster!
Watch how Visual Backlog transforms your Jira experience with intuitive dependency mapping, assisted prioritization, blocker detection and more.
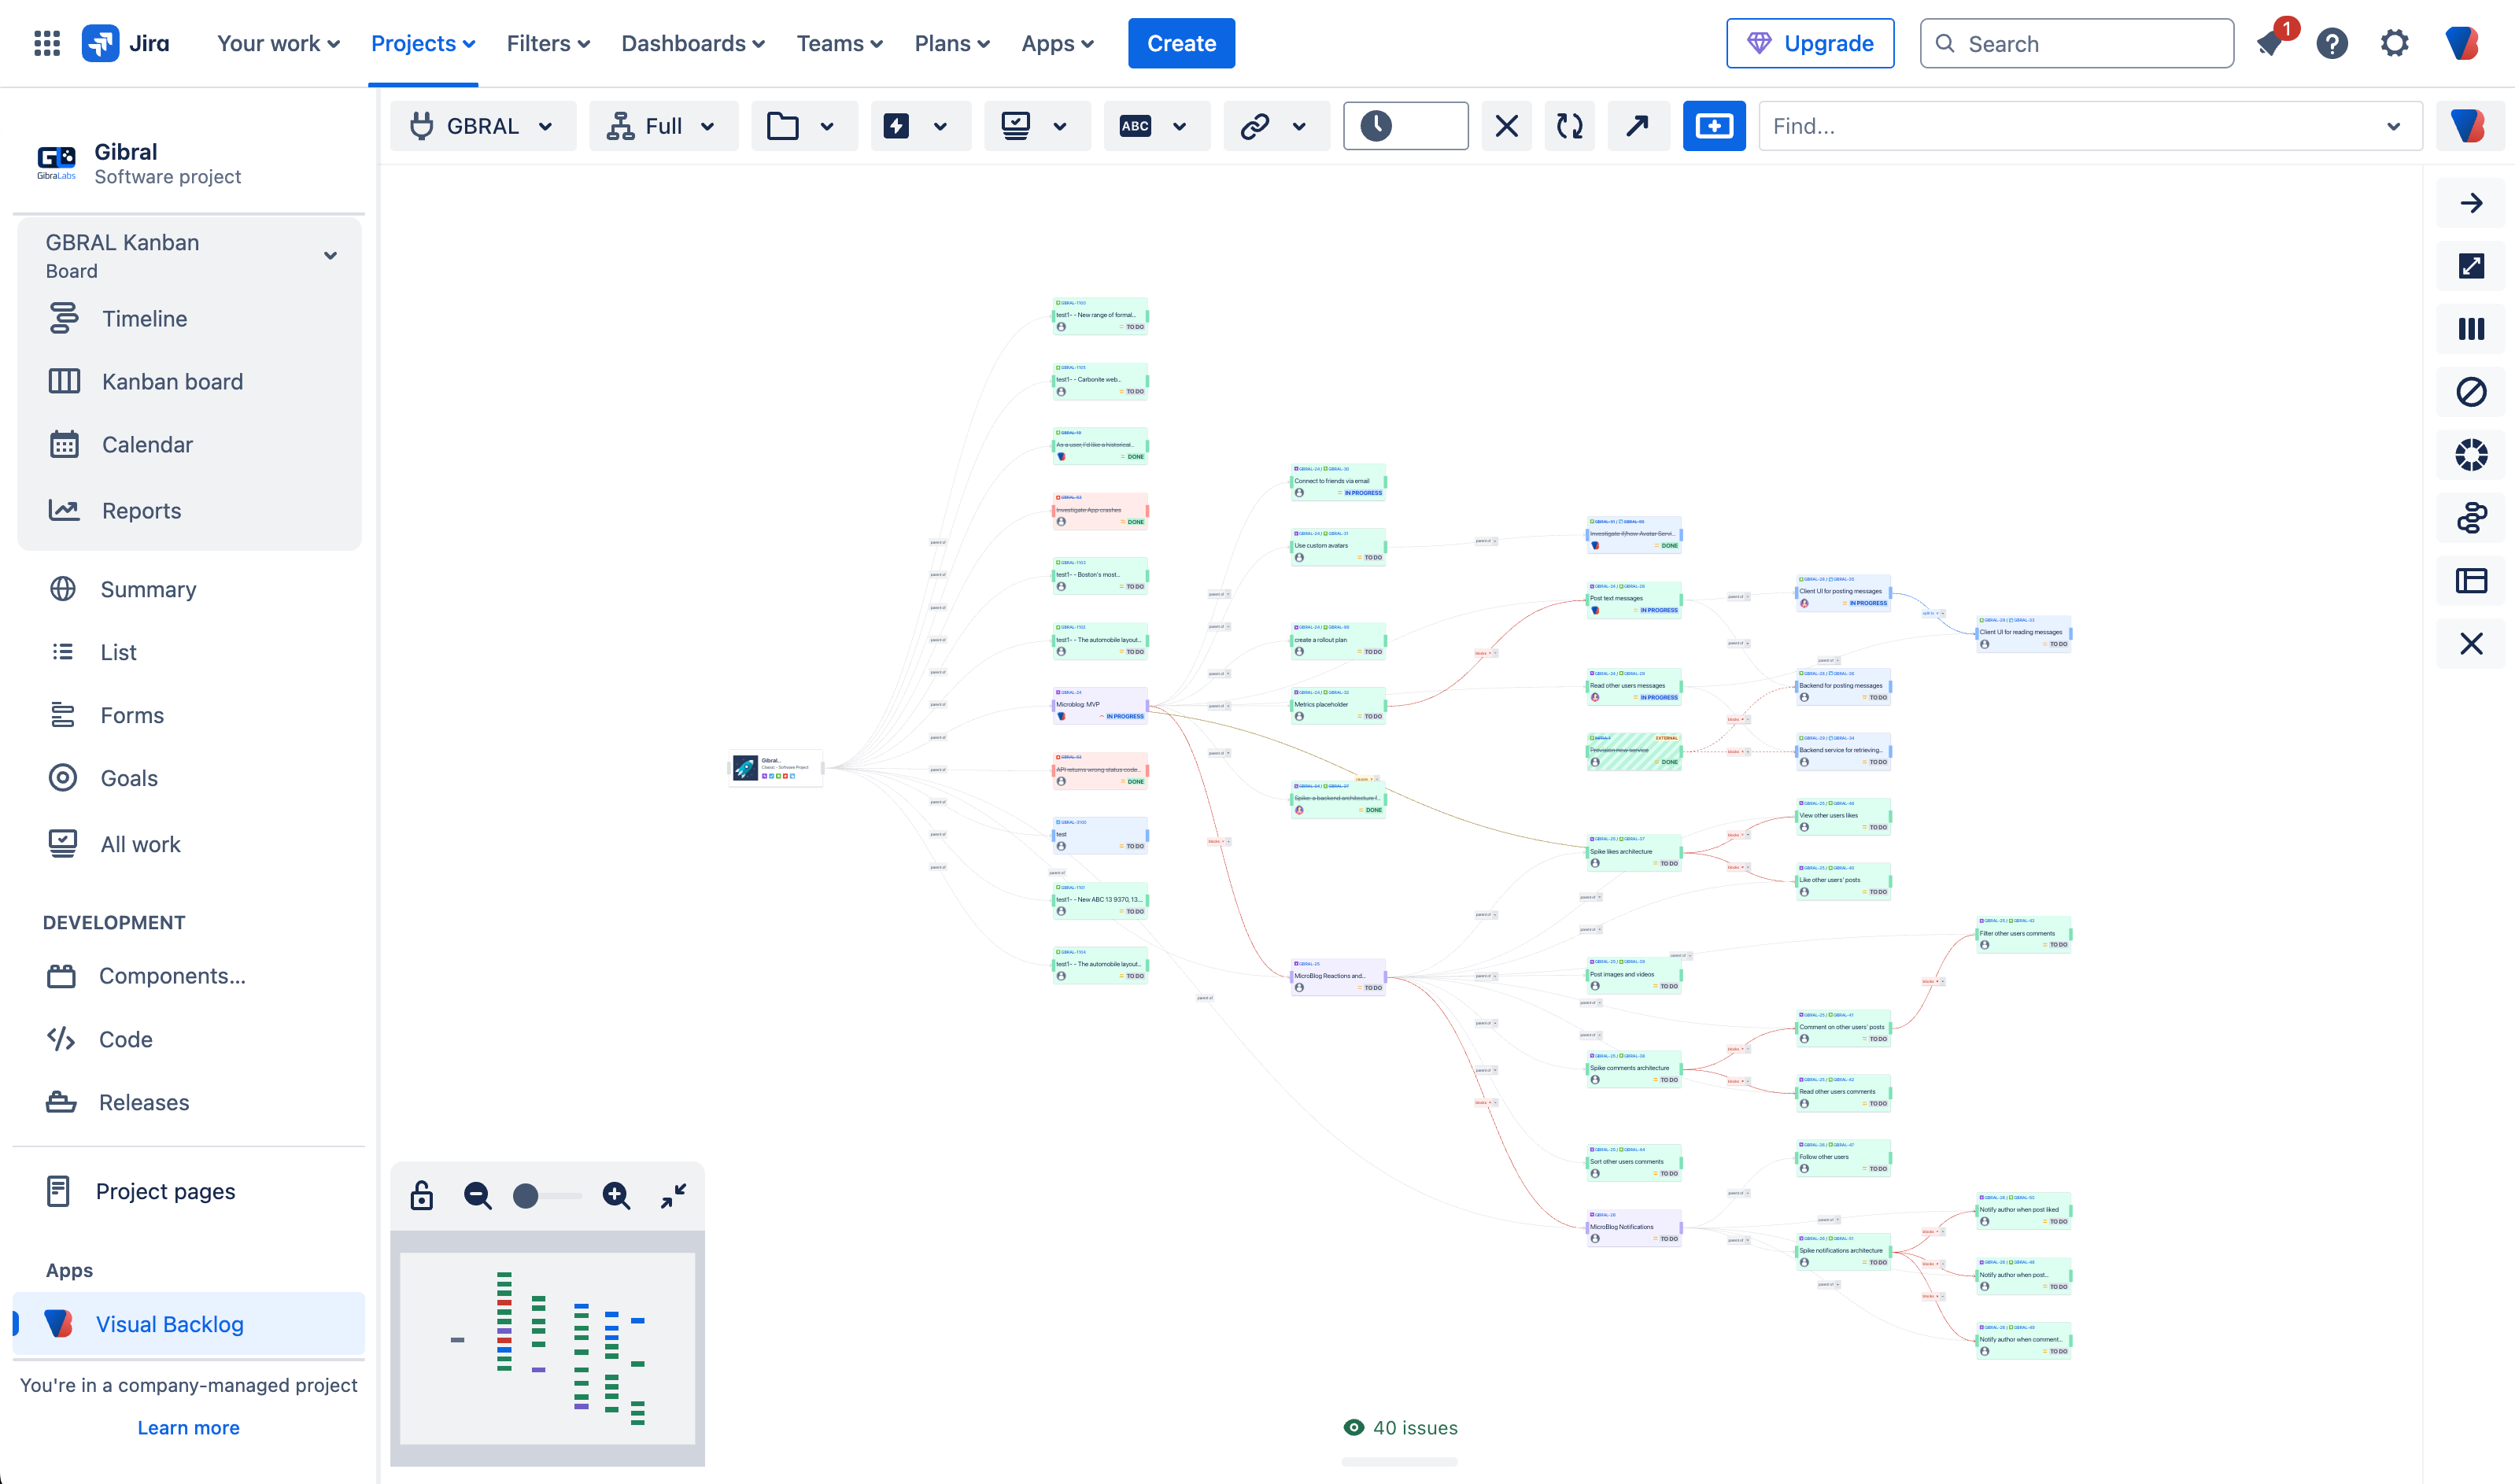
Visualize, create, and edit all issue dependencies (links) in one interactive graph. See the entire network of dependencies at a glance without switching context, instantly understanding how work connects across your projects.
Organize backlog items into prioritization tracks. Focus teams on what matters most, with a visual representation that makes work sequencing intuitive and eliminates confusion about which tasks to address first.
Instantly highlight tickets that are blocking other work. Clearly see which issues need to be tackled first to unblock your project, helping teams prioritize effectively and maintain momentum.
View project status through a color-coded heatmap of your issues. Instantly see which areas are complete, in progress, or not started, providing an intuitive visual overview of your entire project's progress.
Break down project silos with a unified dependency view. Understand how work connects across teams and projects, enabling better coordination and more reliable delivery planning.
Create and edit issues directly from the graph view. Update details, change status, and modify relationships without navigating away from your current view.
Visual Backlog exclusively uses Atlassian-hosted compute and storage infrastructure. This aligns with Atlassian's Runs on Atlassian program, providing secure integration with your Jira environment while maintaining high standards of data protection.
Your data never leaves Atlassian's infrastructure. By using persistent Forge hosted storage, apps can maintain data within Atlassian's environment. Users maintain control over data egress such as analytics and logs, with options to fully disable them.
Visual Backlog fully supports Atlassian's data residency requirements. Your data is automatically pinned to your chosen location (EU, US, AU, DE, SG, CA, IN, KR, JP, GB, or CH) and migrates with your Jira instance when you change locations.
Visual Backlog is crafted by a former Atlassian engineer and manager with deep knowledge of Atlassian's design language, product philosophy, and API architecture. The result is a seamless extension to Jira with reliable integrations and an intuitive interface that feels native to the Atlassian ecosystem.
Start free, scale as you grow
One month free trial. First 10 seats always free, then dynamic tier pricing based on total users.
Get Started| User tier | Annual price |
|---|---|
| Up to 10 | Free |
| 11-15 | USD 150.00 |
| 16-25 | USD 250.00 |
| 26-50 | USD 500.00 |
| 51-100 | USD 1,000.00 |
| 101-200 | USD 2,000.00 |
| 201-300 | USD 2,750.00 |
| 301-400 | USD 3,250.00 |
| 401-500 | USD 3,750.00 |
| 501-600 | USD 4,250.00 |
| 601-800 | USD 5,250.00 |
| 801-1000 | USD 6,250.00 |
| 1001+ | See full pricing table |
| User tier | Price per user/month |
|---|---|
| Up to 10 | Free |
| 11-100 | USD 1.00 |
| 101-250 | USD 1.00 |
| 251-1000 | USD 0.50 |
| 1001-2500 | USD 0.30 |
| 2501-5000 | USD 0.10 |
| 5001-7500 | USD 0.10 |
| 7501-10000 | USD 0.05 |
| 10001-15000 | USD 0.05 |
| 15001-20000 | USD 0.02 |
| 20001-25000 | USD 0.02 |
| 25001+ | USD 0.01 |


Product Manager at Get Driven
Works well, easy to get an overview of relationships between issues. Developer is also fast to respond to questions or reported bugs.

IT Trainer & Chapterlead Software & Architecture
Fantastic to see in 1 overview how your dependencies are stacked up. A real addition to Timeline and/or Plans, as it shows _all_ relations, not just blocks/blocked by. Depedencies on issues from other projects are also shown. Works for us in company- and team-managed projects, both normal Jira (scrum/kanban) and also business projects. Initially I had some issues with the latter (team-managed business project), but the support is very fast and all issues were resolved in a matter of hours. Can recommend!